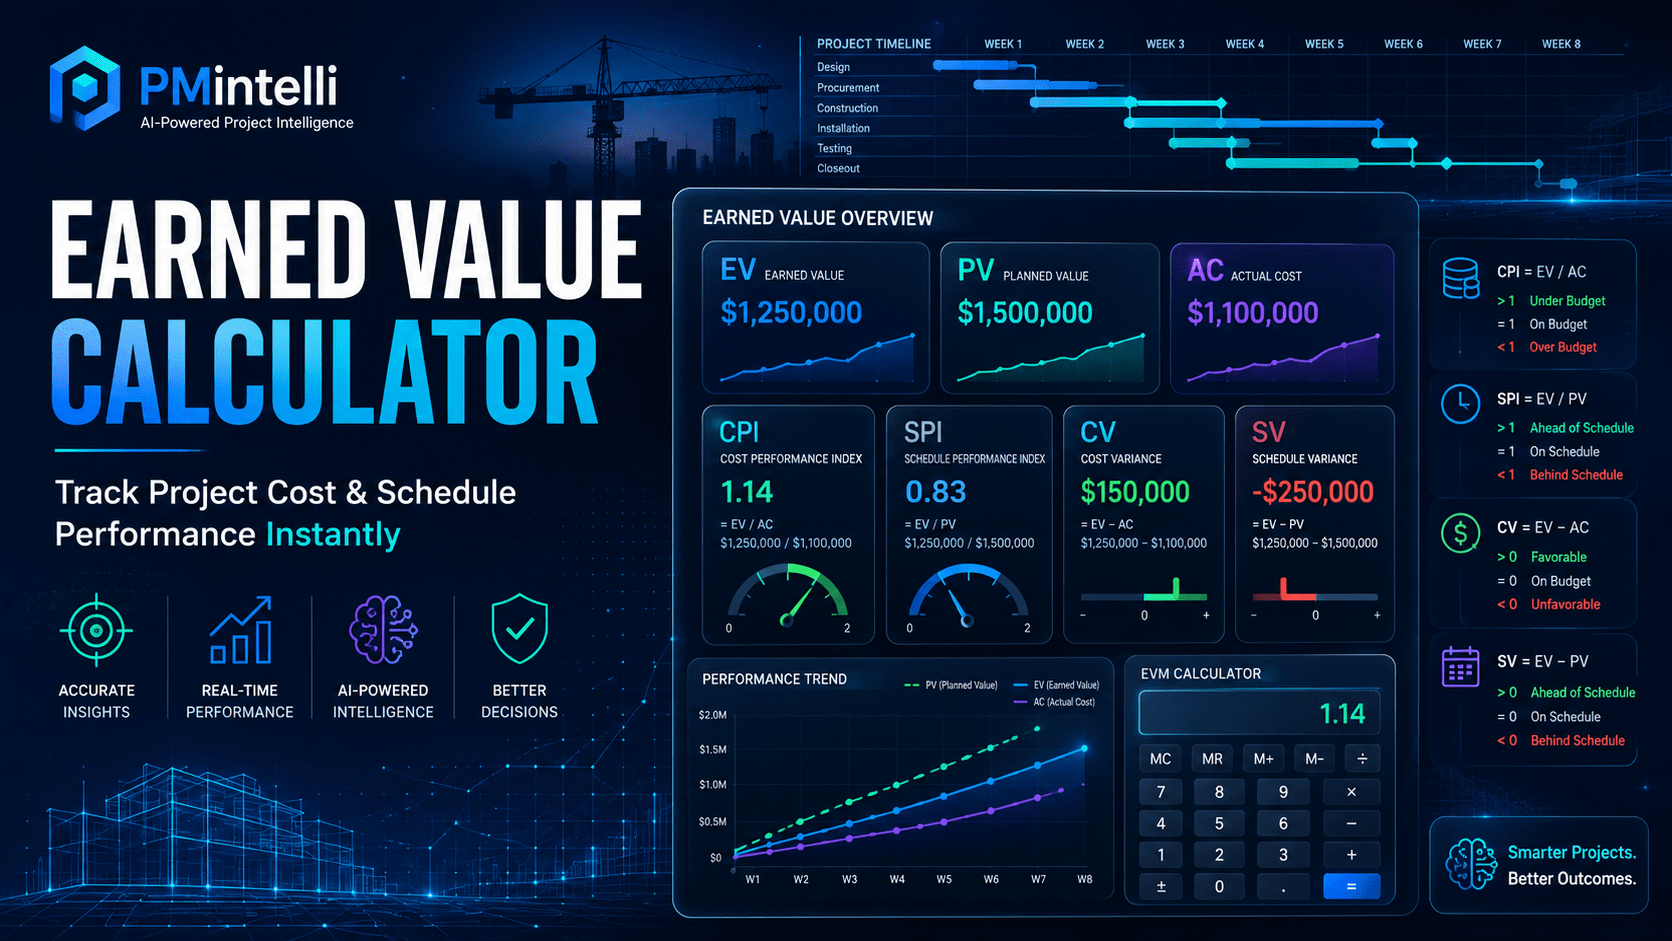
Instant CPI, SPI, EAC, ETC, VAC, CV, SV & TCPI — with interactive charts and automated performance insights. Built for project managers, cost engineers, and construction professionals.
PMBOK® Aligned Real-Time Calculations Export to CSV
Enter Project Data
Total approved project budget
#
Period Date
Planned Value (PV) $
Earned Value (EV) $
Actual Cost (AC) $
Performance KPIs
Performance Charts
Project S-Curve (PV / EV / AC)
CPI & SPI Performance Trend
Cost & Schedule Variance
Cost Forecast (EAC vs BAC)
Detailed Results
Period
PV
EV
AC
CV
SV
CPI
SPI
EAC
Status
Performance Insights
AI-POWERED
How It Works
Three steps to full EVM visibility
STEP 01
Enter Your Data
Input your BAC and per-period PV, EV, and AC values. Add multiple periods for trend analysis or use a single period for snapshot reporting.
STEP 02
Calculate Metrics
Hit Calculate to instantly compute CPI, SPI, CV, SV, EAC, ETC, VAC, and TCPI using PMBOK®-standard formulas with full input safeguards.
STEP 03
Analyze & Export
Review KPI cards, interactive charts, and automated insights. Export to CSV for reporting or print the dashboard for stakeholder meetings.
If you want to Build a Practical WBS for Infrastructure Projects, you must start with one simple principle: structure drives control.
In infrastructure programs—whether highways, water treatment plants, rail systems, or power distribution networks—the Work Breakdown Structure (WBS) is not just a planning tool. It becomes the backbone of:
Cost control
Schedule development
Earned value reporting
Change management
Contract administration
When the WBS is vague or misaligned, reporting becomes unreliable. Forecasts lose credibility. Scope creep hides inside large work packages.
However, when you build a practical WBS correctly, everything else becomes easier to manage.
This article explains how to design a WBS that works in real engineering environments—not just on paper.
What a WBS Really Is (From First Principles)
A Work Breakdown Structure is a structured decomposition of total project scope into manageable components.
That definition sounds straightforward. Yet in practice, many WBS structures fail because they:
Reflect organizational departments instead of deliverables
Combine dissimilar scope elements
Lack measurable boundaries
Do not align with cost codes or schedule activities
A practical WBS must answer one question clearly:
What exactly are we delivering, and how can we measure it?
The WBS should describe deliverables, not activities. Activities live in the schedule. The WBS defines scope containers.
Why You Must Build a Practical WBS for Infrastructure Projects
If any of these elements are missing, refinement is required.
Common Mistakes When Building a WBS
Even experienced PMs fall into predictable traps.
1. Overcomplicating the Structure
Excessive levels create administrative burden.
If field teams cannot understand it, it will not function properly.
2. Making Work Packages Too Large
Example:
“Mechanical Installation – $8M”
This hides:
Pump installation
Piping systems
Valve assemblies
HVAC
Large packages mask productivity problems.
3. Breaking by Internal Departments
Avoid:
Engineering
Procurement
Construction
These are execution phases, not deliverables.
Infrastructure WBS must focus on what gets built.
4. Ignoring Procurement Structure
Long-lead equipment must align with WBS.
For example:
Electrical switchgear procurement should map clearly to:
Electrical Systems → Switchgear Package
This alignment simplifies forecasting.
5. Failing to Update After Change Orders
When approved changes modify scope, update the WBS structure if necessary.
Otherwise, new scope hides inside existing containers.
Practical Tips to Build a Practical WBS for Infrastructure Projects
Here are actionable steps you can apply immediately:
Tip 1: Use the 100% Rule
Ensure all project scope is captured—no more, no less.
Each lower level must collectively represent 100% of the parent scope.
Tip 2: Use Quantities as Anchors
Infrastructure projects revolve around quantities.
Structure WBS elements so they tie directly to:
Linear feet
Cubic yards
Tons
Equipment units
Quantities create clarity.
Tip 3: Involve Field Leaders Early
Field superintendents understand how work is actually executed.
Their input improves practical decomposition.
Tip 4: Align with Payment Schedule
If the contract uses pay items, mirror them in the WBS where possible.
This alignment simplifies billing and reduces disputes.
Tip 5: Test Reporting Before Finalizing
Before locking the WBS:
Run a mock cost report
Run a mock schedule update
Run a mock earned value report
If reporting feels complicated, adjust the structure.
WBS in a PMO Environment
At the portfolio level, standardization improves maturity.
PMOs should:
Establish template WBS structures by project type
Define naming conventions
Standardize coding hierarchy
Audit new projects for compliance
Benefits include:
Easier cross-project comparison
Portfolio-level cost aggregation
Consistent performance reporting
When every project builds its own structure without governance, portfolio visibility collapses.
Integrating WBS with Technology
Modern project control systems rely on structured data.
A practical WBS enables:
Automated reporting
Dashboard development
AI-driven risk analysis
Portfolio forecasting
However, technology cannot compensate for poor structure.
First build the foundation. Then apply digital tools.
Strategic Takeaway: Structure Determines Control
To Build a Practical WBS for Infrastructure Projects, think beyond documentation. Think control architecture.
A well-designed WBS:
Clarifies scope boundaries
Improves cost tracking
Strengthens schedule reliability
Simplifies change management
Enhances stakeholder confidence
Infrastructure projects are complex by nature. Complexity requires structure.
When your WBS reflects real deliverables, measurable quantities, and aligned cost codes, your project controls gain stability.
Ultimately, disciplined structure at the beginning prevents confusion at the end.
Build the WBS correctly—and control follows.
Frequently Asked Questions
Should an infrastructure WBS be organized by project phases or by physical deliverables?
A practical infrastructure WBS should almost always be deliverable-oriented rather than phase-oriented at its highest levels. Organizing strictly by phases (e.g., Design, Procurement, Construction) creates silos and makes it incredibly difficult to track the total cost and true progress of a specific asset. Instead, decomposing the project by physical deliverables or geographic segments (e.g., Substation Alpha, Bridge Deck, Mile Post 10-15) allows you to capture all design, procurement, and construction costs directly under that specific asset. This provides far better visibility for project controls.
How do you apply the "100% Rule" to a massive infrastructure project without making the WBS completely unmanageable?
The 100% Rule states that the WBS must include 100% of the work defined by the project scope and capture all deliverables—internal, external, and interim. To keep this manageable in large-scale infrastructure, you must avoid over-decomposing too early. Focus on capturing the entire scope at a high level first, including non-construction deliverables like utility relocations, environmental permitting, right-of-way acquisitions, and project management support. You can leave lower-level details as "Planning Packages" to be broken down later as more information becomes available.
For linear infrastructure projects like highways, rail, or pipelines, what is the best strategy for breaking down the scope?
Linear projects cross multiple jurisdictions, topographies, and utility networks, making geographical or stationing decomposition the gold standard. Instead of breaking the project down by trade (e.g., all earthwork together, all paving together), split the project into distinct geographic segments or station ranges (e.g., Segment 1: Station 0+00 to 50+00). Under each segment, you can then decompose the work by asset type (e.g., roadway, drainage, retaining walls). This mirrors how the project will actually be built and managed in the field.
How deep should the WBS go, and how does a "Work Package" tie into cost control?
The lowest level of the WBS is the Work Package, and it should stop where the work can be realistically managed, measured, and assigned to a single owner. In infrastructure, a good rule of thumb is that a work package should produce a measurable quantity (e.g., "Install 5,000 LF of 12-inch water main") and align directly with a specific cost code in your Cost Breakdown Structure (CBS). If you go too deep (e.g., breaking "Pour Foundation" into "Tie Rebar," "Set Forms," and "Pour Concrete" at the WBS level), you are no longer building a WBS—you are writing a schedule activity list, which will overwhelm your project controls system.
What is the danger of confusing a WBS with a schedule activity list?
A WBS is a hierarchical map of nouns (deliverables), whereas a schedule is a chronological sequence of verbs (activities). When project teams treat the WBS as a glorified schedule list, they end up with an unstable structure that changes constantly as logic and sequencing shift. A well-constructed WBS acts as a permanent backbone for the project. While the schedule activities, logic ties, and dates will change daily, the WBS remains fixed, providing a reliable framework for cost collection, earned value management, and performance reporting.
Faster, Smarter, and More Predictive Risk Management
A well-built Risk Register is essential for managing uncertainty in any project. It helps project teams identify threats and opportunities, evaluate their impact, and plan proactive responses. Traditionally, creating a comprehensive register takes time, expertise, and multiple workshops.
But with today’s AI tools, you can generate a high-quality risk register in minutes—complete with probability scoring, impacts, mitigation plans, and role assignments.
Below is a step-by-step guide showing how AI transforms the risk management process, along with examples and accompanying images (generated in the next messages).
Why Use AI for Risk Management?
AI enhances risk management by:
Rapidly generating a comprehensive list of risks
Suggesting probability and impact ratings
Providing sample mitigation and contingency plans
Helping standardize risk categories across projects
Speeding up preparation for workshops and proposals
Instead of brainstorming from scratch, you can begin with an 80–90% complete draft and refine it with stakeholders.
Step-by-Step: Creating a Risk Register with AI
### Step 1 — Provide Project Context
AI performs best when given clear project details such as scope, duration, stakeholders, budget, and environment.
Example Input:
“Create a risk register for a 24-month wastewater pump station upgrade project. Include technical, environmental, scheduling, safety, and stakeholder risks.”
### Step 2 — Ask AI to Generate a Risk Register
A single prompt can produce an entire draft list of risks with probability, impact, score, mitigation, and owners.
Example Prompt:
“Generate a Risk Register in table format with the following columns: ID, Category, Risk Description, Probability (1–5), Impact (1–5), Risk Score, Mitigation Plan, Contingency Plan, Risk Owner.”
### Step 3 — Review & Customize
AI-generated risks are a starting point. Your team should refine:
AI can help expand vague mitigation plans into SMART actions.
Example:
AI-generated baseline mitigation: “Coordinate early with utility agencies.”
Refined using AI: “Establish biweekly coordination meetings with utility agencies; secure written relocation timelines; assign a Utility Coordinator; integrate utility impacts into the project schedule using a linked logic path.”
Start permitting early; assign a permit specialist
Accelerate post-approval activities
Environmental Lead
R-04
Safety
Confined space risks during wet well entry
2
5
10
Safety training; gas monitoring; rescue plan
Halt work and reassess safety controls
Safety Officer
R-05
Stakeholder
Nearby residents complain about noise
3
3
9
Limit nighttime work; noise barriers
Adjust work hours
PM
Using AI to Automate Ongoing Risk Monitoring
AI can also help:
Summarize weekly risk updates
Flag risks with increasing impact
Rewrite mitigation plans for clarity
Generate dashboard-ready summaries
Draft communication updates for clients
This shifts project managers from admin-heavy tasks to strategic decision-making.
Final Thoughts
AI doesn’t replace the project manager or risk manager—but it dramatically accelerates the process of creating, refining, and managing a project risk register.
You get:
✔ Faster workshops ✔ Better-quality mitigation plans ✔ A standardized approach across all projects ✔ More time for leadership and analysis