Visit PM Intelli Hub YouTube Channel

AI-Powered Skills for Project Managers

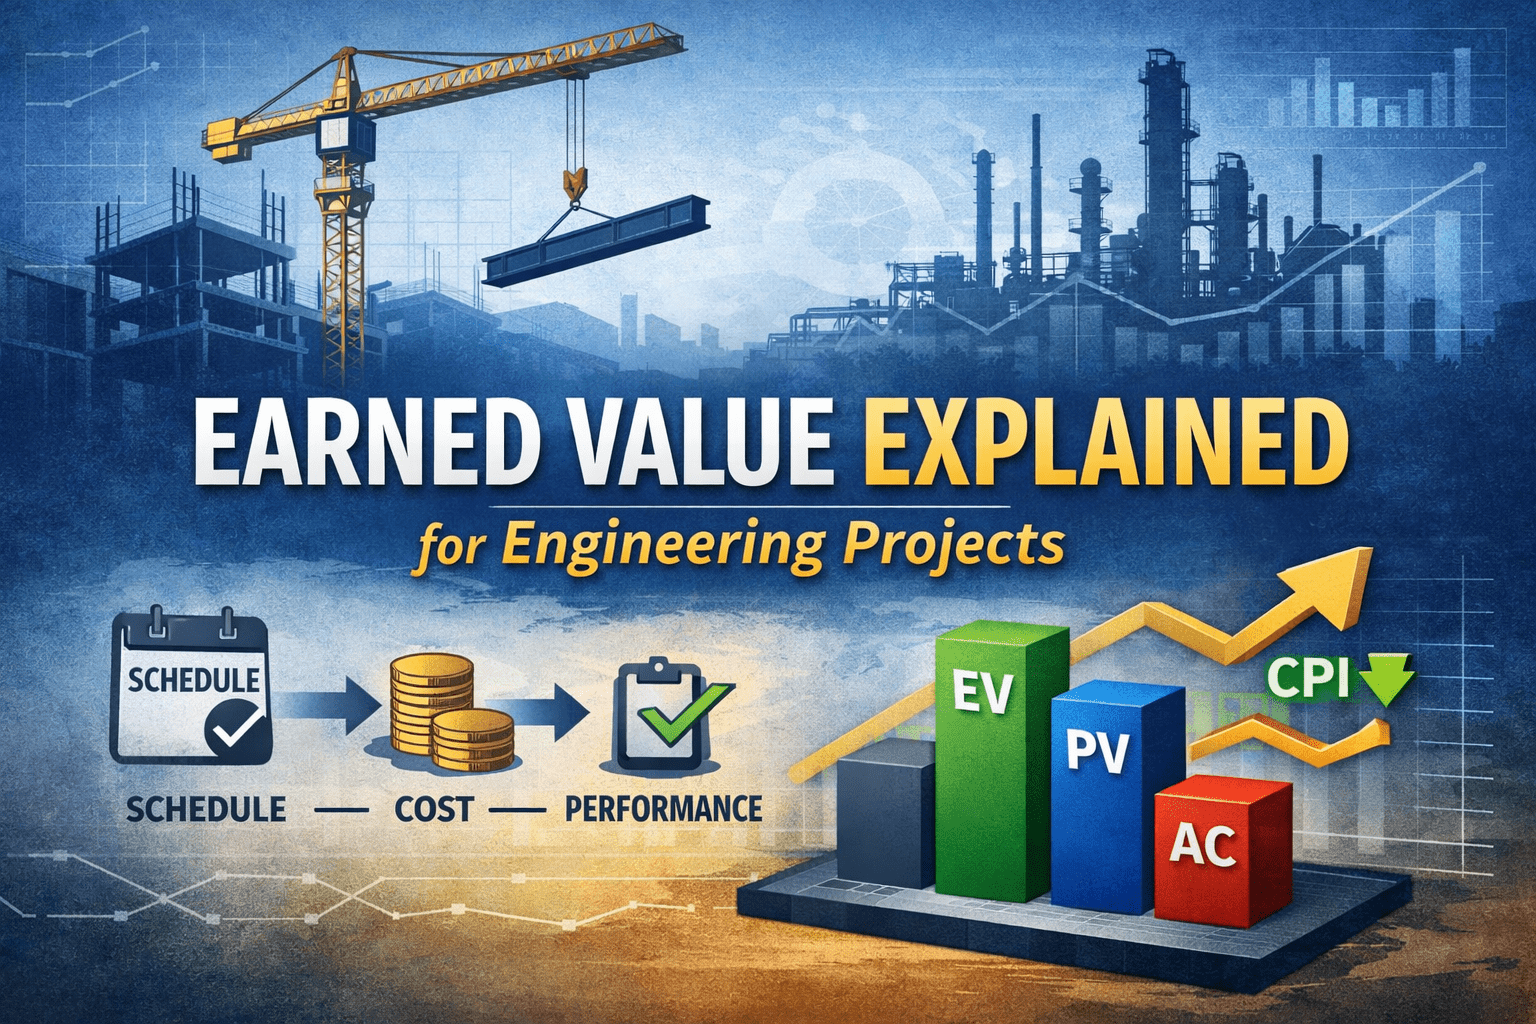
Earned Value Explained for Engineering Projects

Engineering projects rarely fail because of technical complexity alone.
They fail because leaders lose visibility over cost, schedule, and performance at the same time.

That is why Earned Value Explained clearly and practically matters for project managers, schedulers, cost engineers, and PMO leaders. It connects scope, time, and cost into a single performance picture. Instead of asking:

  • “Are we on schedule?”
  • “Are we under budget?”

Earned Value asks the more powerful question:

“Are we getting the value we planned for the money and time we’ve spent?”

For engineering and infrastructure projects—where contracts are large, risks are high, and public scrutiny is real—this distinction is critical.


What Earned Value Really Means

Many professionals overcomplicate Earned Value Management (EVM). At its core, the concept is simple:

  • Planned Value (PV): What we planned to complete by today.
  • Earned Value (EV): What we actually completed (in budget terms).
  • Actual Cost (AC): What we actually spent.

Earned Value compares these three numbers to reveal performance truth.

Think of it this way:

  • Schedule tells you time.
  • Cost reports tell you money.
  • Earned Value tells you performance.

Without Earned Value, you may think you're “50% done” because you've spent 50% of the budget. But spending money is not progress. Completing measurable scope is progress.


Earned Value Explained Step by Step

Let’s break it down in practical engineering terms.

Step 1: Define Measurable Scope

Everything begins with a solid Work Breakdown Structure (WBS).

If your WBS is vague, Earned Value will fail.
Engineering projects must define measurable deliverables such as:

  • Install 5,000 LF of water main
  • Pour 2,000 CY of concrete
  • Complete 100% of design package
  • Install 12 structural beams

Each activity must have:

  • A budget
  • A duration
  • A measurable completion method

For deeper guidance, you may reference PMIntelli’s article:
👉 How to Build a Practical WBS for Infrastructure Projects


Step 2: Assign Budget to Work (Planned Value)

Planned Value (PV) represents the approved budget for scheduled work.

Example:
A wastewater pump station project has:

ActivityBudgetPlanned % Complete by Month 3PV
Excavation$200,000100%$200,000
Foundation$500,00060%$300,000
Structural Steel$800,00025%$200,000
Total PV$700,000

By Month 3, we planned to complete $700,000 worth of work.


Step 3: Measure Earned Value (EV)

Earned Value reflects actual physical progress, expressed in budget terms.

Suppose actual progress shows:

  • Excavation: 100% complete → $200,000 earned
  • Foundation: 40% complete → $200,000 earned
  • Structural Steel: 10% complete → $80,000 earned

Total Earned Value = $480,000

Even though we planned $700,000, we only earned $480,000.

This is where reality becomes visible.


Step 4: Capture Actual Cost (AC)

Assume the accounting system shows:

  • Actual Cost = $650,000

Now we have the full picture:

MetricValue
PV$700,000
EV$480,000
AC$650,000

Step 5: Interpret the Results

Now the power of Earned Value Explained becomes clear.

Schedule Variance (SV)

SV = EV – PV
= $480,000 – $700,000
= –$220,000

We are behind schedule.


Cost Variance (CV)

CV = EV – AC
= $480,000 – $650,000
= –$170,000

We are over budget.


Performance Indexes

IndexFormulaResultMeaning
SPIEV / PV0.69Behind schedule
CPIEV / AC0.74Cost inefficient

Interpretation:

  • For every $1 planned, we are earning $0.69.
  • For every $1 spent, we are getting $0.74 of value.

That is an early warning signal—not a postmortem.


Why Earned Value Matters in Engineering Projects

Engineering projects have:

  • Long durations
  • High capital investment
  • Contractual payment structures
  • Liquidated damages risks

Without Earned Value:

  • You may report “70% spent” and assume good progress.
  • Meanwhile, physical progress may only be 50%.

In design-build, heavy civil, or public infrastructure projects, that gap can destroy margins quickly.


Real-World Example: Highway Expansion Project

Consider a $120M highway widening project.

At Month 12:

  • Budget Planned: $40M
  • Actual Spent: $45M
  • Physical Progress Measured: 30% of total scope
  • Total Budget: $120M

Earned Value = 30% × $120M = $36M

Now compare:

  • EV = $36M
  • AC = $45M
  • PV = $40M

Interpretation:

  • Behind schedule (36 < 40)
  • Over budget (36 < 45)

Without Earned Value, management might say:

“We’ve spent $45M. That seems aligned.”

But Earned Value reveals the real issue:

The project is earning only $0.80 per dollar spent.

That early insight allows:

  • Crew reallocation
  • Subcontractor performance review
  • Productivity root cause analysis
  • Cash flow forecast adjustments

Common Mistakes When Applying Earned Value

Even experienced PMs misuse EVM. Here are the most frequent issues.

1. Measuring Effort Instead of Output

Percent complete should reflect deliverables, not time spent.

Bad example:
“Activity is 50% complete because half the duration passed.”

Good example:
“4 out of 8 beams installed = 50%.”


2. Poor WBS Structure

If scope packages are too large, progress becomes subjective.

Instead of:

  • “Mechanical Installation – $5M”

Break it into:

  • Pump installation
  • Piping systems
  • Electrical integration
  • Commissioning

Granularity improves accuracy.


3. Ignoring Schedule Logic

Earned Value does not replace CPM scheduling.

You still need:

  • Proper critical path analysis
  • Logic-driven sequencing
  • Float monitoring

For more on this, see PMIntelli’s article:
👉 Baseline Vs. Current Schedule


4. Using EV Only for Reporting

Earned Value is a management tool, not a dashboard decoration.

If SPI drops below 0.90, leadership must act immediately.


Practical Tips to Implement Earned Value Immediately

You do not need a government megaproject to use EVM. Here is how to apply it practically:

1. Start with Major Cost Drivers

Focus on:

  • Civil works
  • Structural components
  • Equipment procurement
  • Long-lead materials

2. Use Simple Percent Complete Rules

Choose objective methods:

  • 0/100 rule (for short tasks)
  • 50/50 rule (start/finish)
  • Measured quantity installed
  • Milestone-based measurement

3. Align Finance and Scheduling

Cost data must match schedule structure.

If accounting codes and WBS do not align, Earned Value becomes unreliable.

PMOs should standardize coding across projects.


4. Forecast Early Using CPI and SPI

If CPI remains at 0.85, final cost overrun is predictable.

Forecast Estimate at Completion (EAC):

EAC = Budget / CPI

If Budget = $10M
CPI = 0.80

EAC = $12.5M

That insight allows executive intervention before the problem escalates.

👉 Check our Earned Value Calculator


Earned Value in PMO Environments

At the portfolio level, Earned Value enables:

  • Cross-project comparison
  • Early risk detection
  • Executive reporting consistency
  • Resource allocation decisions

A PMO can track:

  • Projects with CPI < 0.90
  • Projects with SPI < 0.95
  • Trend deterioration over 3 reporting cycles

This shifts governance from reactive to proactive.

For strategic PMO thinking, see:
👉 What is a PMO - Roles, Types and Benefits


When Earned Value Is Not Enough

Earned Value does not measure:

  • Quality issues
  • Safety incidents
  • Scope changes not yet budgeted
  • External risks

Therefore, it must be integrated with:

  • Risk registers
  • Change management logs
  • Safety KPIs
  • Quality metrics

EVM shows performance efficiency—not technical adequacy.


Strategic Takeaway: Why Earned Value Explained Matters

Engineering projects demand disciplined control.
Earned Value provides a structured, quantitative truth.

It answers three critical leadership questions:

  1. Are we earning what we planned?
  2. Are we spending efficiently?
  3. Where will we finish if current trends continue?

When used correctly:

  • It protects margins.
  • It improves forecast credibility.
  • It strengthens client confidence.
  • It elevates PMO maturity.

Earned Value is not about formulas.
It is about decision-making clarity.

For project managers, schedulers, and cost engineers, mastering Earned Value means moving from reporting history to controlling outcomes. That is the real power behind Earned Value Explained


Frequently Asked Questions

Why can't I just compare my actual costs against the planned budget to see how my project is doing?

Traditional variance analysis only tells you what you spent versus what you planned to spend, completely ignoring what you actually accomplished.
EVM introduces a third variable: Earned Value (EV)—the budgeted cost of work actually performed. Without EV, if you spent $50,000 of a $100,000 engineering budget, you might assume you are exactly on track. However, if you have only completed 20% of the drawing packages, you are actually significantly over budget and behind schedule. EVM exposes this gap.

How do CPI and SPI work, and how do I interpret their values?

The Cost Performance Index (CPI) and Schedule Performance Index (SPI) are efficiency metrics calculated as ratios:
Cost Performance Index (CPI): Measures financial efficiency.
$$CPI = \frac{EV}{AC}$$
Schedule Performance Index (SPI): Measures time efficiency relative to the plan.
$$SPI = \frac{EV}{PV}$$
How to read the results:
Value = 1.0: Exactly on target.
Value > 1.0: Favorable performance (under budget or ahead of schedule).
Value < 1.0: Unfavorable performance (over budget or behind schedule).

How should a project manager determine "Percent Complete" for subjective tasks like engineering design?

Objectivity is the greatest challenge in EVM. To avoid the trap of a project being "90% complete for half the project duration," engineering PMs should use Weighted Milestones.
Instead of guessing progress, assign fixed, earning percentages to verifiable gates:
10% upon Kickoff & Data Collection
30% upon 30% Schematic Review Approval
30% upon 90% Detailed Design Review Approval
30% upon Final Issued for Construction (IFC) Package Approval
For physical field construction, switch to Physical Percent Complete based on quantifiable units (e.g., linear feet of pipe installed or tons of steel erected).

What is the difference between ETC and EAC, and how do they forecast project cost overruns?

Both metrics are forward-looking forecasting tools used to project final outcomes while there is still time to pivot:
Estimate to Complete (ETC): The expected cost required to finish all remaining project work.
Estimate at Completion (EAC): The anticipated total cost of the project when the entire scope is finished.
A standard formula to calculate EAC, assuming the project will continue to perform at its current cost efficiency rate, is:
$$EAC = \frac{BAC}{CPI}$$
(Where $BAC$ is the original Budget at Completion.)

Why can the Schedule Performance Index (SPI) sometimes give a misleading picture near the end of a project?

SPI measures the total volume of work completed against the volume planned, not critical path delays. Because of this, SPI has a dangerous mathematical quirk: as a project reaches its final stages, the Planned Value ($PV$) stops growing, and the Earned Value ($EV$) eventually catches up as late tasks are completed.
Consequently, SPI will always drift back toward 1.0 at the end of a project, even if the project is months behind schedule. To get an accurate picture of time constraints, a PM must always pair EVM metrics with Critical Path Method (CPM) schedule analysis to track true project duration and float.
How AI Improves Cost Estimating and Forecasting Accuracy

Why Cost Accuracy Still Breaks Projects

Cost overruns are rarely caused by a single bad estimate. More often, they result from small assumptions compounding over time—scope gaps, outdated unit rates, slow feedback loops, and missed early warning signals.

This is where AI changes the game.

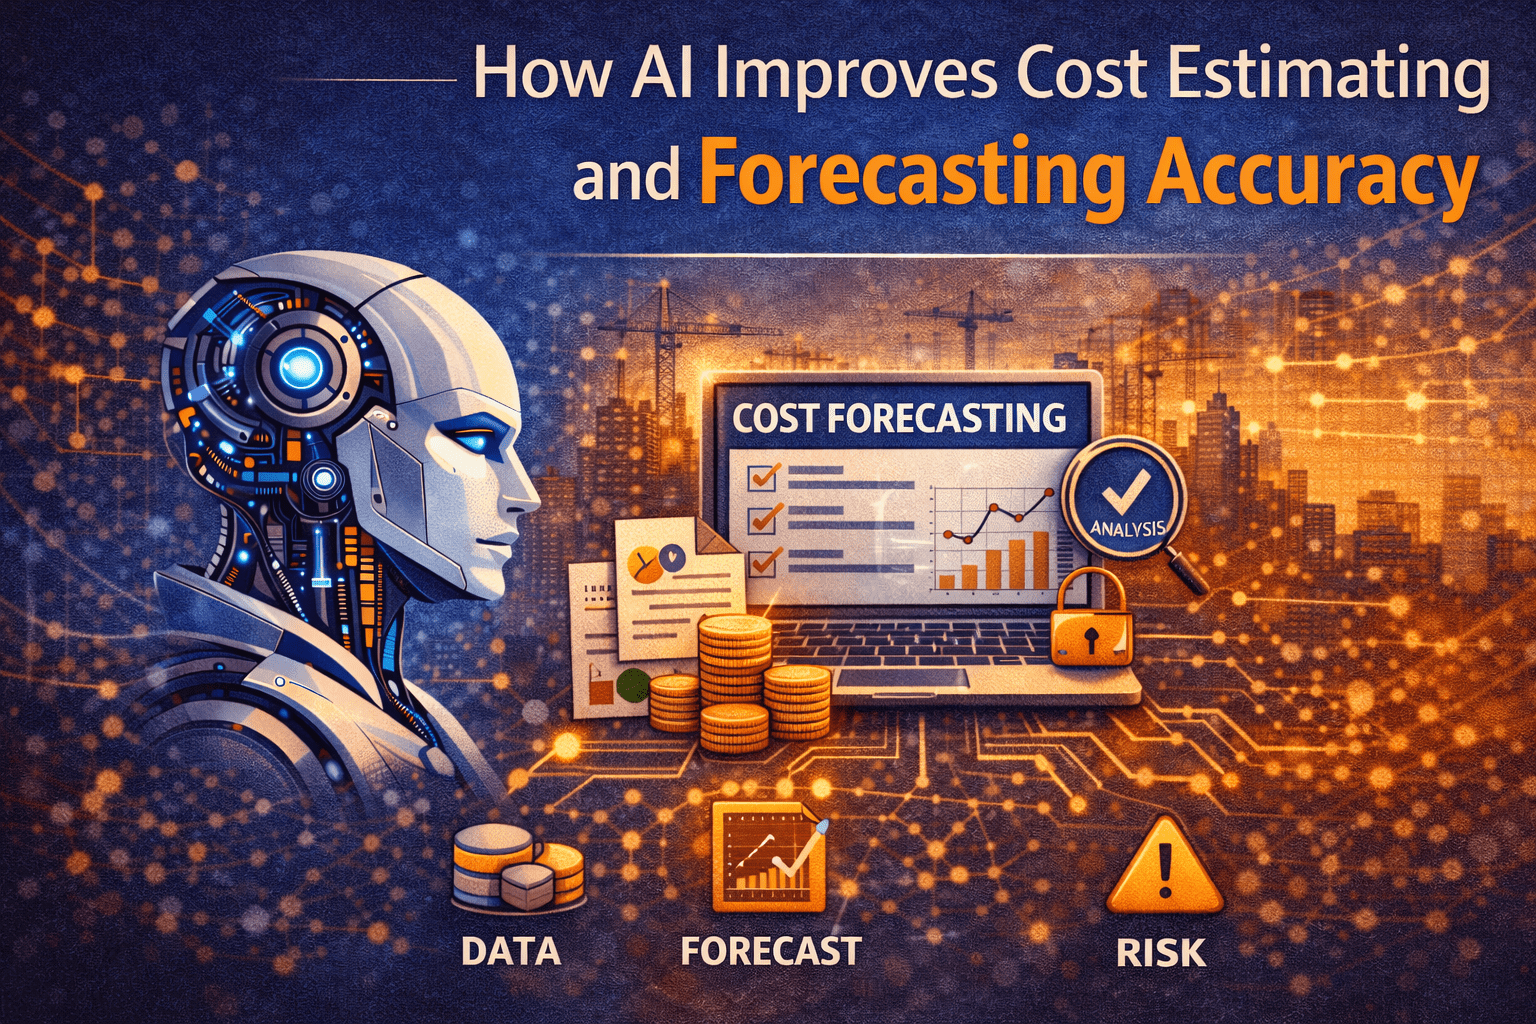
Understanding how AI improves cost estimating and forecasting is no longer optional for project managers, cost engineers, and PMO leaders. AI does not replace professional judgment. Instead, it strengthens it by processing large volumes of historical data, identifying hidden patterns, and updating forecasts faster than traditional methods allow.

This article explains how AI improves cost estimating and forecasting accuracy, step by step, using practical project examples and first-principles reasoning.


Why Traditional Cost Estimating Struggles

Before looking at AI, it helps to understand the limits of conventional approaches.

Most cost estimates rely on:

  • Historical projects that may not be fully comparable
  • Static assumptions locked in early
  • Manual updates performed infrequently
  • Human bias, both optimistic and conservative

Even well-built estimates degrade over time when conditions change faster than forecasts.

AI improves accuracy by addressing these weaknesses directly.


What AI Actually Does in Cost Estimating

AI does not “guess” costs.

At its core, AI analyzes relationships between data points that humans struggle to process at scale. In cost estimating, this means identifying how scope, quantities, productivity, risk, and market conditions interact over time.

AI systems learn from:

  • Historical cost data
  • Schedule performance trends
  • Change orders and claims history
  • External market indicators

The result is a continuously improving estimating and forecasting capability.


How AI Improves Cost Estimating: Step by Step

Step 1: Improving Data Quality Before Estimating

Bad data leads to bad estimates.

AI helps by:

  • Flagging inconsistent cost codes
  • Identifying missing quantities
  • Normalizing historical cost data across projects

Instead of assuming historical data is reliable, AI evaluates its consistency before using it.

👉 Project Control Explained: The Foundation of Successful Project Management


Step 2: Enhancing Parametric and Analogous Estimates

Traditional parametric estimating relies on fixed ratios.

AI enhances this by:

  • Adjusting cost relationships dynamically
  • Accounting for project size, complexity, and location
  • Identifying non-linear cost drivers

For example, AI can recognize that doubling project size does not double indirect costs, and it adjusts estimates accordingly.


Step 3: Detecting Hidden Cost Drivers

Many cost overruns originate from drivers that were not explicitly modeled.

AI identifies patterns such as:

  • Design changes increasing rework costs
  • Schedule compression driving labor inefficiency
  • Interface complexity increasing management overhead

These insights improve early estimates before problems materialize.


Step 4: Integrating Schedule and Cost Forecasting

Cost and schedule are inseparable.

AI improves forecasting accuracy by linking:

  • Schedule performance trends
  • Resource loading patterns
  • Productivity curves

When schedule slippage occurs, AI immediately recalculates cost impacts instead of waiting for manual updates.


Step 5: Continuous Forecast Updates Instead of Periodic Reforecasts

Traditional forecasts are often monthly snapshots.

AI enables:

  • Rolling forecasts
  • Early detection of cost drift
  • Automated scenario analysis

This allows project teams to respond earlier, when corrective action is still affordable.

👉 How to Create a Project Budget Dashboard: Step-by-Step Guide for Project Managers


How AI Improves Cost Forecasting Accuracy Over Time

Learning From Project Execution

As a project progresses, AI continuously compares:

  • Planned vs. actual costs
  • Estimated vs. achieved productivity
  • Forecasted vs. realized risks

Each comparison improves future forecasts.

This learning loop is something spreadsheets cannot replicate.


Reducing Human Bias in Forecasts

Humans tend to:

  • Underestimate uncertainty early
  • Delay reporting negative trends
  • Smooth forecasts to avoid scrutiny

AI provides objective signals that help teams confront issues earlier.


Scenario Modeling Without Extra Effort

AI allows teams to test:

  • Scope growth scenarios
  • Market escalation impacts
  • Delay recovery strategies

Instead of rebuilding estimates manually, AI generates comparative outcomes quickly.


Real-World Project Example: Infrastructure Program

On a multi-year infrastructure program:

  • AI analyzed five years of historical cost data
  • Early forecasts identified productivity decline trends
  • Management adjusted staffing and sequencing

The result was a measurable reduction in forecast variance and fewer late-stage budget surprises.

The improvement did not come from perfect estimates—but from faster learning.


Real-World Project Example: IT System Implementation

In a large IT rollout:

  • AI tracked change request patterns
  • Forecasts incorporated approval cycle delays
  • Cost impacts were predicted months earlier

This allowed leadership to adjust scope priorities before overruns accumulated.


Common Mistakes When Using AI for Cost Estimating

AI is powerful, but misuse reduces its value.

Avoid these mistakes:

  • Treating AI outputs as final answers
  • Feeding AI poorly structured data
  • Ignoring model assumptions
  • Using AI without governance
  • Expecting accuracy without oversight

AI supports professionals; it does not replace accountability.


Practical Tips Project Managers Can Apply Immediately

You do not need a full AI platform to start improving accuracy.

Begin with:

  • Cleaning historical cost data
  • Standardizing cost codes
  • Linking schedule and cost performance
  • Using AI tools for variance analysis
  • Reviewing forecasts more frequently

Even small steps improve forecast reliability.

👉 AI Prompt Engineering for Project Managers: The Complete Practical Guide


How AI Fits Into Project Controls Governance

AI must operate within defined controls.

Effective governance includes:

  • Clear data ownership
  • Defined forecast approval processes
  • Transparency in AI assumptions
  • Regular validation against actuals

Without governance, AI creates noise instead of insight.


Strategic Takeaway: Accuracy Is About Learning Speed

Perfect estimates do not exist.

The real value of AI is not eliminating uncertainty—it is learning faster than uncertainty grows.

When project teams understand how AI improves cost estimating and forecasting, they shift from reactive reporting to proactive management.

That shift is what protects budgets, schedules, and credibility.


Engineering Project Cost Management Best Practices

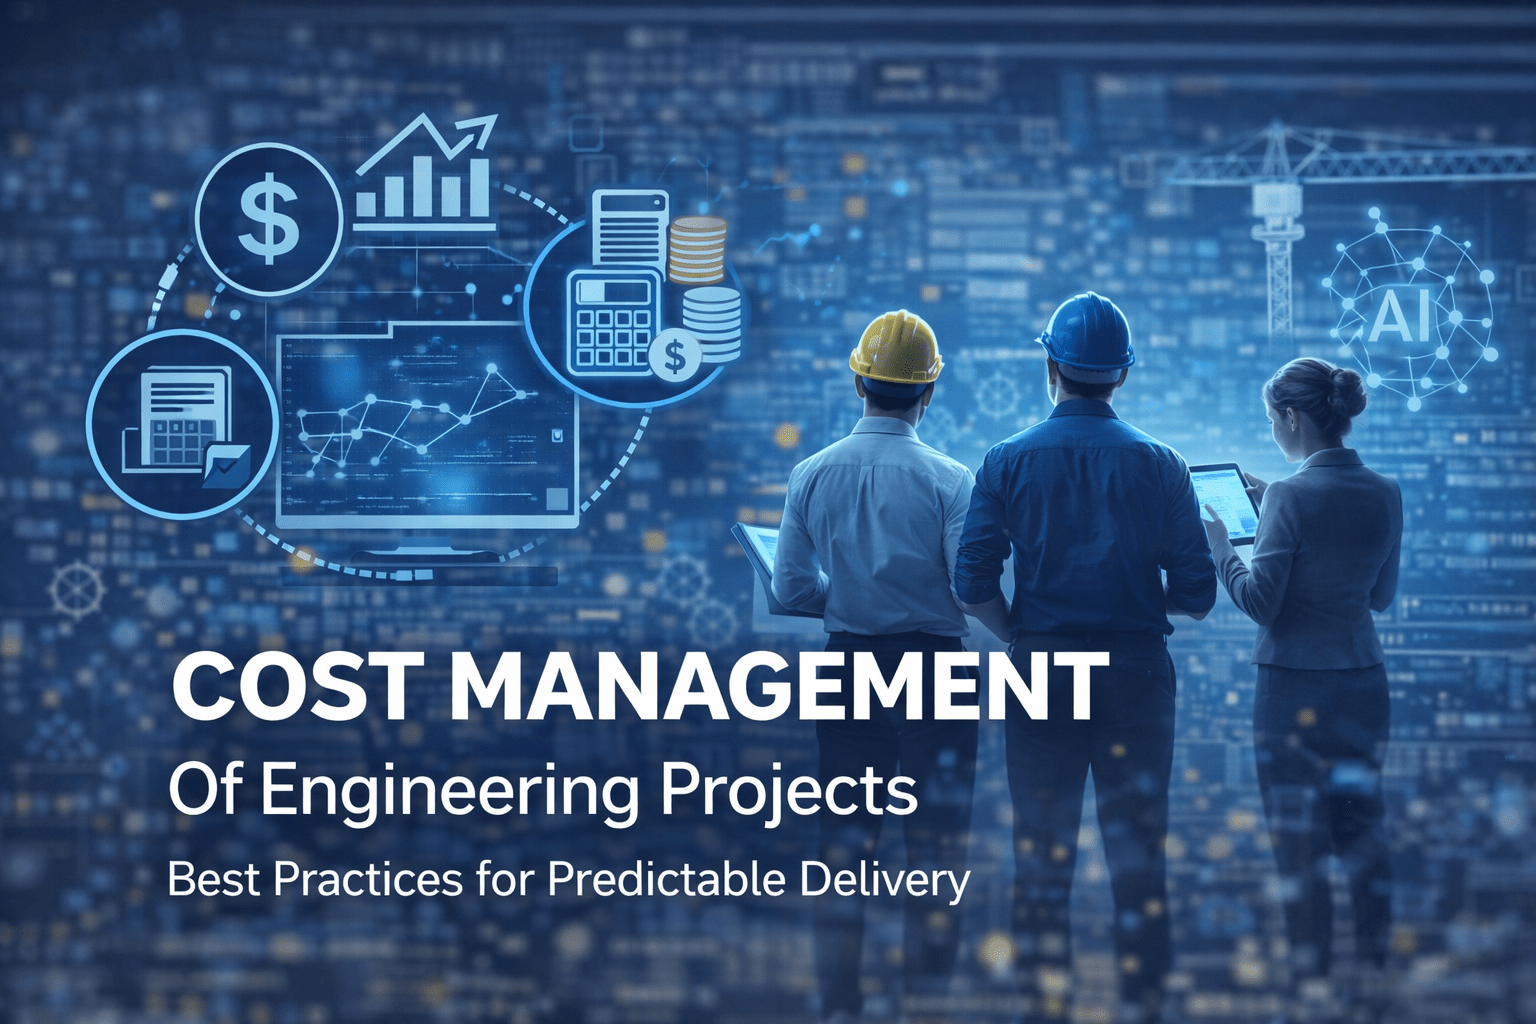
Engineering projects—whether in construction, infrastructure, utilities, or industrial facilities—are capital‑intensive and technically complex. Without disciplined engineering project cost management, even well‑designed projects can suffer from overruns, disputes, and loss of stakeholder confidence.

This guide explains how cost management works in engineering projects, the key processes involved, common failure points, and modern best practices—including how AI and project controls improve forecasting and financial predictability.


Table of Contents

  • What Is Cost Management in Engineering Projects?
  • Why Cost Management Is Critical in Engineering Projects
  • Key Cost Management Processes in Engineering Projects
  • Common Cost Management Challenges in Engineering Projects
  • Role of Project Controls in Cost Management
  • How AI Is Transforming Cost Management in Engineering Projects
  • Best Practices for Engineering Project Cost Management

What Is Cost Management in Engineering Projects?

Cost management in engineering projects is the structured process of planning, estimating, budgeting, controlling, and forecasting costs to ensure delivery within approved financial limits.

Unlike simple expense tracking, engineering cost management integrates:

  • Engineering quantities and design maturity
  • Construction productivity and sequencing
  • Procurement and contract strategies
  • Schedule impacts and critical path changes
  • Risk and uncertainty

Effective cost management provides early warning indicators, not just historical reporting.


Why Cost Management Is Critical in Engineering Projects

Engineering projects face unique financial pressures:

  • Long execution durations
  • Scope evolution during design development
  • Volatile labor and material markets
  • Regulatory and environmental constraints
  • High exposure to claims and change orders

Without proactive project cost control, small deviations can escalate into major overruns.


Key Cost Management Processes in Engineering Projects

1. Cost Estimating

Cost estimating establishes the financial foundation of the project. Estimates evolve as engineering maturity increases:

  • Conceptual estimates (Class 4/5)
  • Preliminary estimates (Class 3)
  • Definitive estimates (Class 1/2)

Accurate engineering cost estimates rely on:

  • Quantified takeoffs
  • Historical cost data
  • Market intelligence
  • Risk allowances

2. Cost Budgeting and Baseline Development

Once approved, the estimate becomes the cost baseline, including:

  • Direct costs
  • Indirect costs
  • Contingency
  • Management reserves

The baseline must be time‑phased and aligned with the project schedule to support effective cost control.


3. Cost Control and Monitoring

Cost control ensures actual spending aligns with the approved baseline through:

  • Tracking actual costs
  • Measuring earned value
  • Monitoring commitments
  • Identifying variances early

This allows project teams to act before overruns materialize.


4. Change Management and Cost Impact Analysis

Engineering projects inevitably experience scope changes. Effective cost management requires:

  • Formal change control procedures
  • Cost and schedule impact assessments
  • Approval documentation
  • Integration with claims management

Uncontrolled changes remain a leading cause of cost overruns.


5. Cost Forecasting and Trend Analysis

Forecasting predicts the estimate at completion (EAC) using:

  • Trend analysis
  • Earned Value Management (EVM)
  • Productivity analysis
  • Risk‑adjusted forecasting

Forecasts should be updated regularly and communicated clearly to decision‑makers.


Common Cost Management Challenges in Engineering Projects

  • Limited estimate accuracy due to early‑stage design
  • Poor integration between schedule and cost
  • Weak change control discipline
  • Delayed cost reporting
  • Reactive rather than predictive forecasting

These challenges highlight the need for strong project controls systems.


Role of Project Controls in Cost Management

Project controls integrate cost, schedule, risk, and performance measurement into a single control framework.

A mature project controls function ensures:

  • Cost and schedule alignment
  • Consistent forecasting
  • Reliable performance metrics
  • Executive‑level transparency

👉 Related reading: Project Control Explained: The Foundation of Successful Project Management


How AI Is Transforming Cost Management in Engineering Projects

Artificial intelligence is reshaping engineering cost management by:

  • Predicting cost overruns using historical data
  • Identifying abnormal spending patterns
  • Improving estimate accuracy
  • Automating cost reporting
  • Supporting scenario‑based decision making

AI allows cost managers to shift from reactive reporting to predictive and prescriptive control.

👉 Related reading: The Future of Project Management: Five AI Trends Redefining 2026 and BeyondI in Project Management: Tools, Use Cases & Future Trends


Best Practices for Engineering Project Cost Management

✔ Establish realistic, risk‑adjusted baselines
✔ Integrate cost and schedule data
✔ Apply disciplined change control
✔ Forecast costs regularly—not just monthly
✔ Use AI and analytics for early trend detection
✔ Maintain transparent stakeholder communication


Final Thoughts

Cost management in engineering projects is not merely a financial task—it is a strategic project controls discipline.

By combining sound estimating practices, integrated project controls, proactive forecasting, and emerging AI technologies, organizations can significantly improve cost predictability and reduce financial risk.

Engineering projects will always involve uncertainty—but effective cost management ensures uncertainty does not become surprise.


image_print