
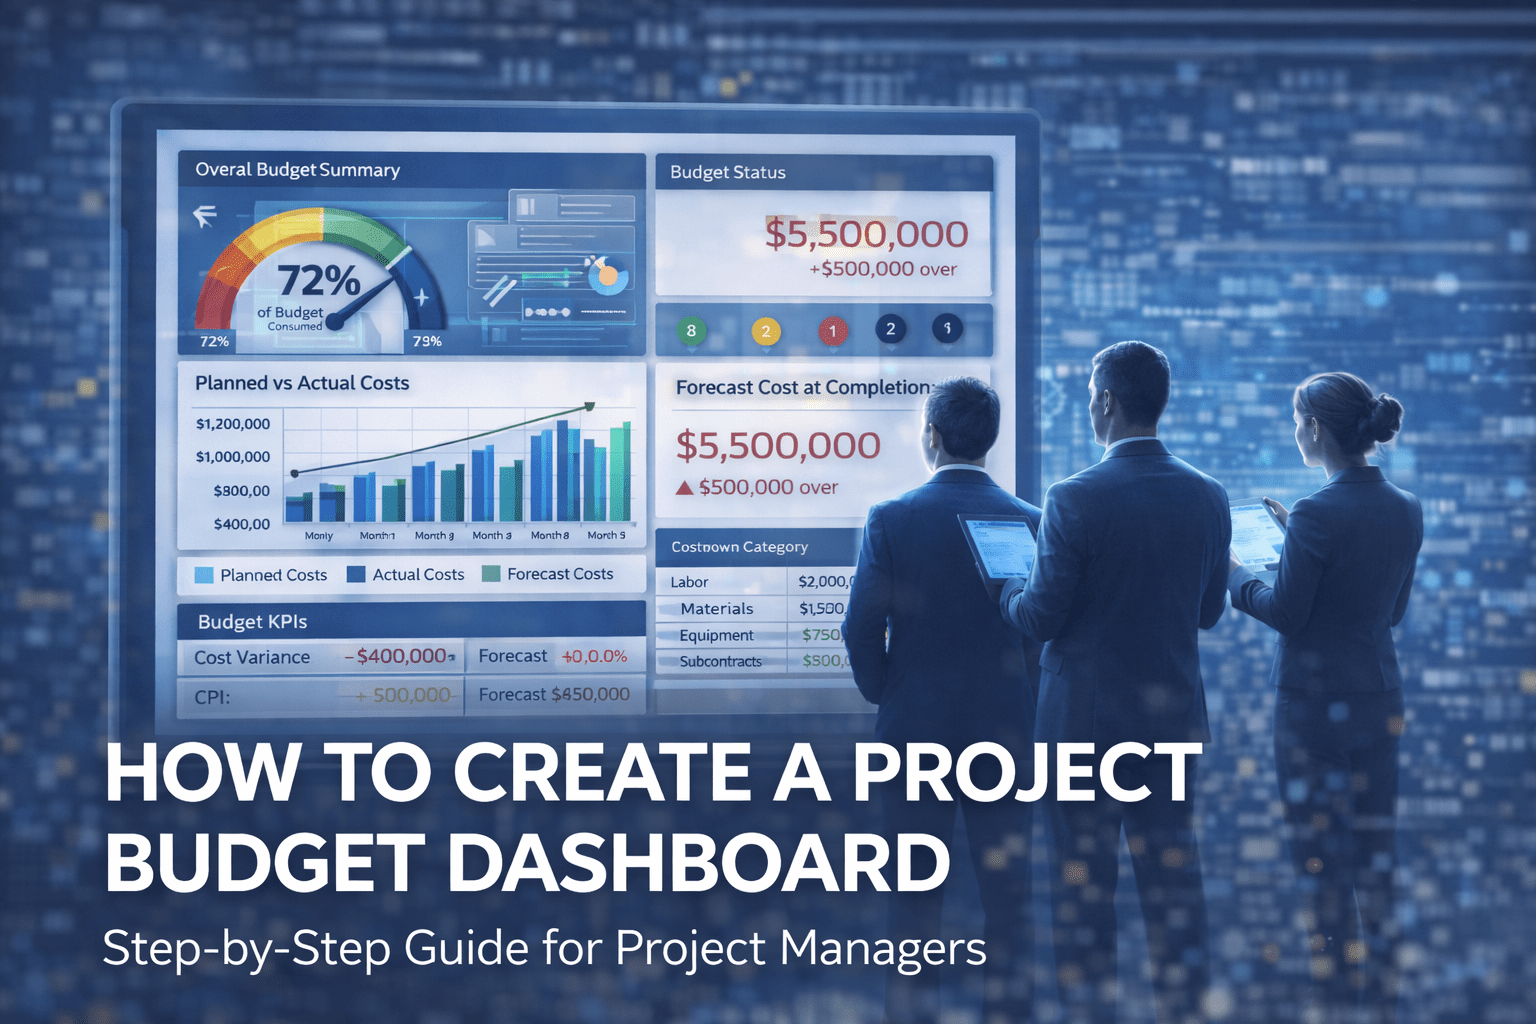
A project can appear on track while silently drifting toward a budget overrun. This is why a well-designed project budget dashboard is one of the most powerful tools in project management and project controls.
A budget dashboard transforms raw financial data into clear, actionable insights—allowing project managers to detect issues early, communicate effectively with stakeholders, and make data-driven decisions.
This guide explains how to create a project budget dashboard step by step, what metrics to include, common mistakes to avoid, and how AI is enhancing modern budget dashboards.
What Is a Project Budget Dashboard?
A project budget dashboard is a visual reporting tool that summarizes a project’s financial performance in real time or near real time. It consolidates cost data into charts, indicators, and KPIs that show:
- Planned vs actual costs
- Forecasted final cost
- Cost variances and trends
- Financial risks and exposure
Unlike static spreadsheets, dashboards provide ongoing visibility and support proactive cost management.
Why Budget Dashboards Are Critical for Project Success
Budget dashboards help project teams:
- Detect cost overruns early
- Improve financial transparency
- Support executive decision-making
- Strengthen accountability
- Align cost, schedule, and scope
For PMOs and large engineering projects, dashboards are essential for portfolio-level oversight.
Step 1: Define the Purpose and Audience
Before building the dashboard, clarify:
Who Will Use It?
- Project managers
- PMO leadership
- Executives and sponsors
What Decisions Should It Support?
- Cost corrective actions
- Funding approvals
- Change management decisions
An executive dashboard should be high-level, while a project controls dashboard can include more detail.
Step 2: Identify Key Budget Metrics (KPIs)
A strong project budget dashboard focuses on a limited set of meaningful KPIs.
Core Budget Metrics to Include
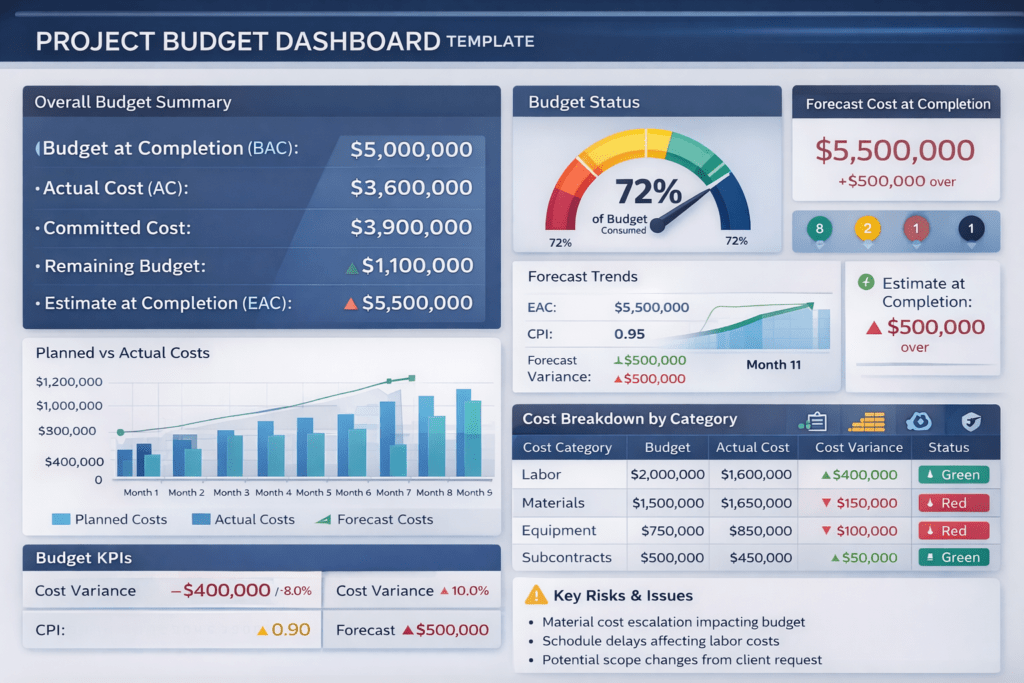
- Approved Budget (BAC)
- Actual Cost (AC)
- Committed Cost
- Remaining Budget
- Estimate at Completion (EAC)
- Cost Variance (CV)
- Cost Performance Index (CPI)
These metrics provide a complete picture of current and future financial performance.
Step 3: Integrate Cost and Schedule Data
Budget dashboards are most effective when cost and schedule are integrated.
Examples:
- Time-phased budgets aligned with the schedule
- Cost performance linked to progress (earned value)
- Forecasts adjusted based on schedule delays
This integration is a core principle of project controls best practices.
Step 4: Choose the Right Visualization Types
The way data is displayed matters as much as the data itself.
Recommended Dashboard Visuals
- Bar charts – Planned vs actual cost
- Trend lines – Forecast evolution over time
- Gauge charts – Budget consumption percentage
- Traffic light indicators – Cost status (green, amber, red)
- Tables – Detailed cost breakdowns
Avoid clutter—clarity drives adoption.
Step 5: Design the Dashboard Layout
An effective layout follows a logical hierarchy:
- Top section – Overall budget status and key KPIs
- Middle section – Trends and forecasts
- Bottom section – Cost breakdowns and notes
Executives should understand the dashboard in less than 30 seconds.
Step 6: Automate Data Updates Where Possible
Manual dashboards quickly become outdated. Use automation to:
- Pull data from accounting or ERP systems
- Update forecasts automatically
- Reduce reporting effort
Automation improves accuracy and frees project teams to focus on analysis instead of data entry.
Step 7: Add Forecasting and Scenario Analysis
A dashboard should not only show what happened—but what is likely to happen.
Advanced dashboards include:
- Rolling forecasts
- Best-case and worst-case scenarios
- Risk-adjusted cost projections
This transforms the dashboard into a decision-support tool.
Common Mistakes to Avoid
- Too many metrics on one screen
- No clear link to decision-making
- Static dashboards that are rarely updated
- Ignoring forecast accuracy
- Lack of stakeholder alignment
Simplicity and relevance are key.
How AI Is Enhancing Budget Dashboards
Modern AI-powered budget dashboards can:
- Predict cost overruns based on trends
- Detect anomalies in spending
- Improve forecast accuracy
- Generate automated insights and alerts
AI enables project managers to move from reactive reporting to predictive cost control.
Best Practices for Effective Budget Dashboards
✔ Focus on decision-driving metrics
✔ Keep visuals simple and intuitive
✔ Integrate cost, schedule, and risk
✔ Update dashboards regularly
✔ Use AI and analytics for forecasting
✔ Align dashboards with governance needs
Final Thoughts
A project budget dashboard is more than a reporting tool—it is a financial control system.
When designed correctly, it improves transparency, strengthens accountability, and enables proactive cost management. As projects grow more complex, dashboards—especially those enhanced by AI—are becoming essential for predictable project delivery.

2 thoughts on “How to Create a Project Budget Dashboard”