
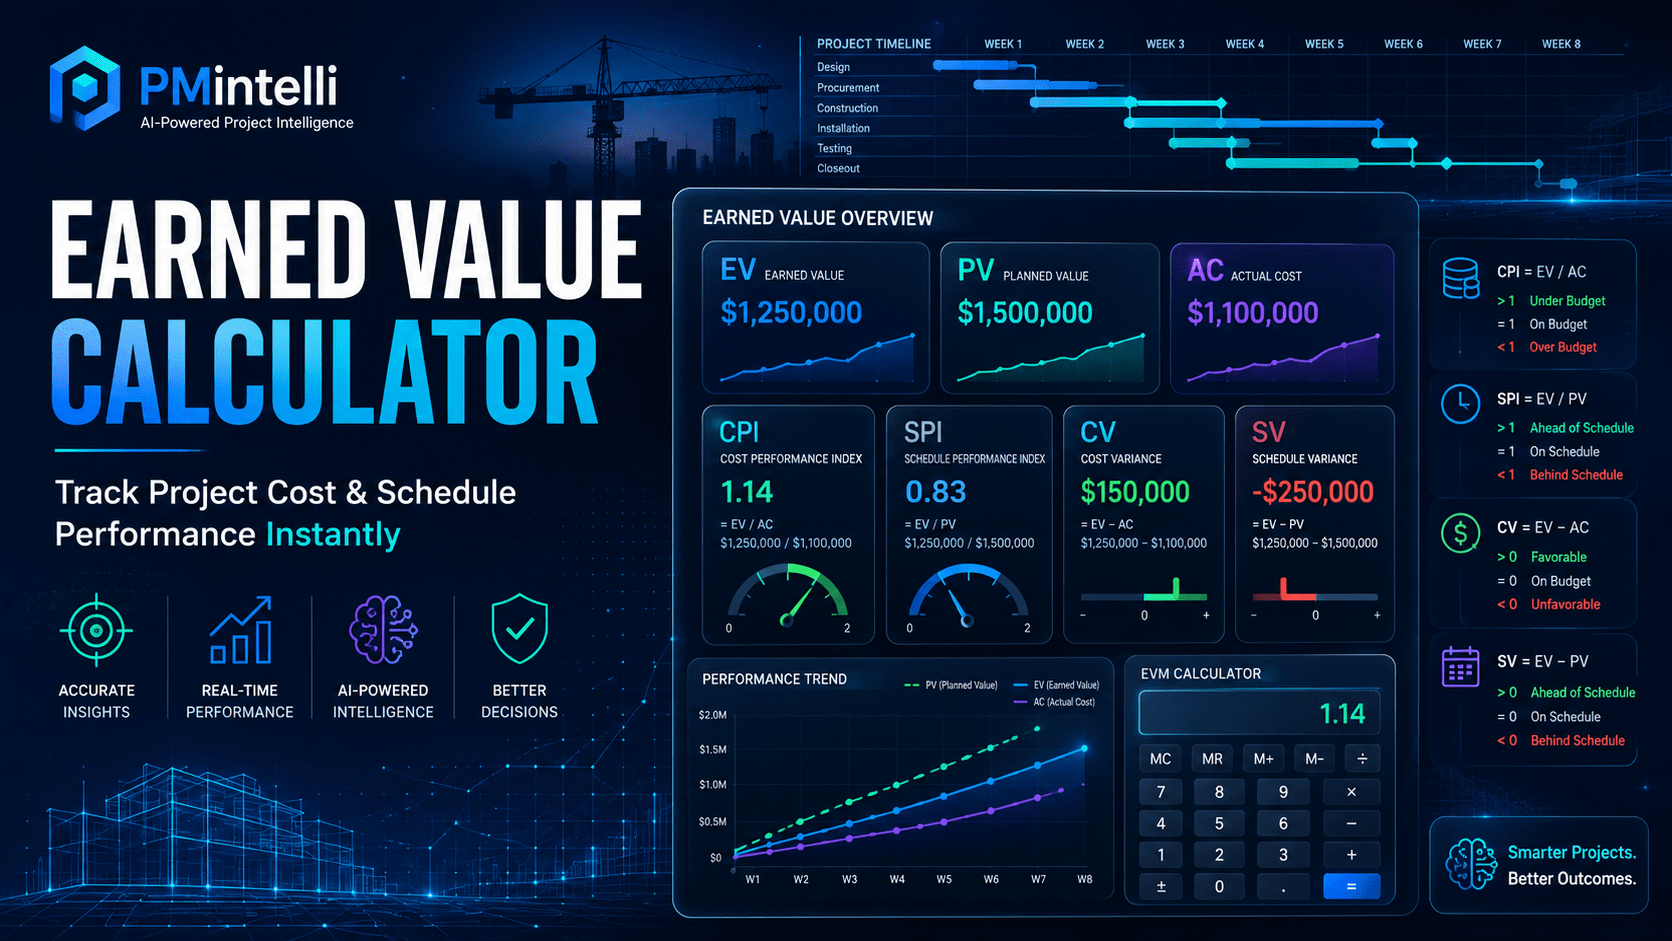
Earned Value Calculator
Instant CPI, SPI, EAC, ETC, VAC, CV, SV & TCPI — with interactive charts and automated performance insights. Built for project managers, cost engineers, and construction professionals.
Enter Project Data
| # | Period Date | Planned Value (PV) $ | Earned Value (EV) $ | Actual Cost (AC) $ |
|---|
Performance KPIs
Performance Charts
Project S-Curve (PV / EV / AC)
CPI & SPI Performance Trend
Cost & Schedule Variance
Cost Forecast (EAC vs BAC)
Detailed Results
| Period | PV | EV | AC | CV | SV | CPI | SPI | EAC | Status |
|---|
Performance Insights AI-POWERED
How It Works
Three steps to full EVM visibility
Enter Your Data
Input your BAC and per-period PV, EV, and AC values. Add multiple periods for trend analysis or use a single period for snapshot reporting.
Calculate Metrics
Hit Calculate to instantly compute CPI, SPI, CV, SV, EAC, ETC, VAC, and TCPI using PMBOK®-standard formulas with full input safeguards.
Analyze & Export
Review KPI cards, interactive charts, and automated insights. Export to CSV for reporting or print the dashboard for stakeholder meetings.
Frequently Asked Questions
About Earned Value Management

